(づ ◕‿◕ )づ Jacques Thurling
Terminal Charts in C++
Jan 06, 2025Creating different charts for the terminal in C++
This is a smaller project to test how to create different chart in the terminal with C++
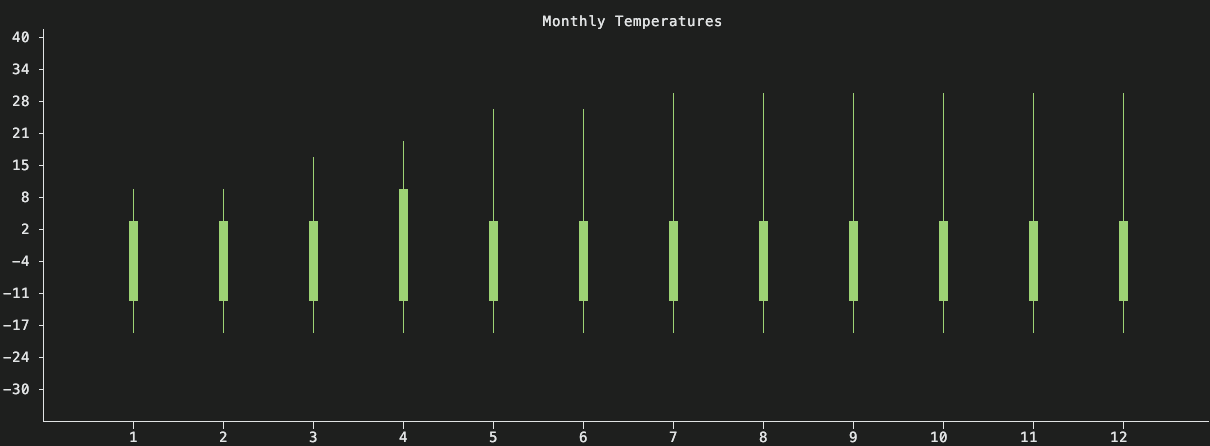
Candlestick Chart
The first test was to create a Candlestick chart similar to those seen in financial industries , specifically those that usually seen on Trading platforms

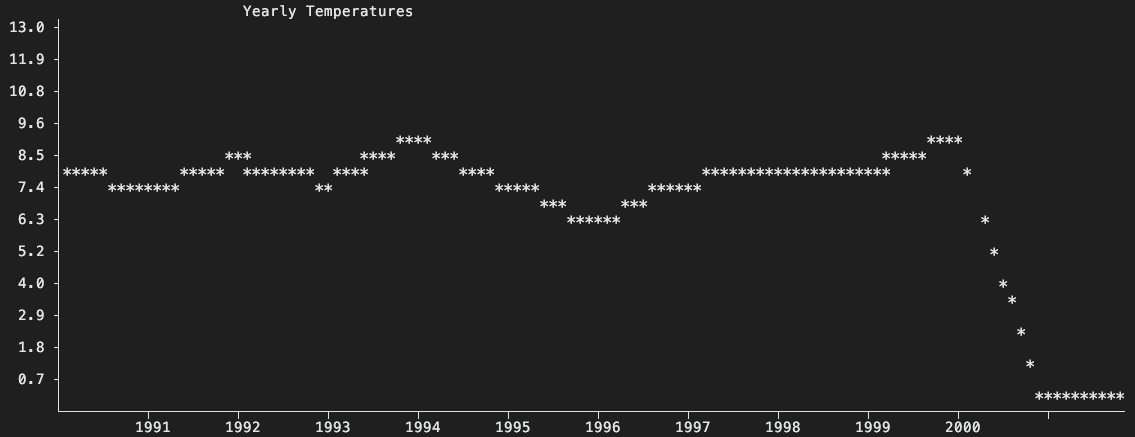
Normal Graph chart
Next on the list was just to create a normal line chart connecting different (x, y) positions at equidistant point along the x-axis, the final result can be seen in the image below

To achieve this, I used linear interpolation to deternine the y-coords for the corresponding x-character coords. In order to achieve this, we used the following formula:
\[x_1 +\frac{i}{n-1}(x_2-x_1)\]Which is the following code:
double ChartRenderer::linearSpace(double y1, double y2, double i) {
  return y1 + (i / (10 - 1)) * (y2 - y1);
}
For the code, you can have a look here: